

AACR 2021 Poster #2929: Predicting Patient’s Therapeutic Response and Acquired Drug Resistance with Orthotopic Patient-Derived Xenografts (O-PDX)
Patient-derived xenografts (PDX) are a commonly used in vivo model that can provide clinically relevant, personalized tumor data. It’s used for drug development and precision oncology, providing a more accurate way for patients, oncologists, and drug developers to predict tumor growth, test mono- and combination therapies, forecast drug resistance, and track metastasis. Ultimately, this helps clinical teams make better treatment decisions and assess outcomes.
But not all PDX methodologies mimic clinical courses the same: The most widely used PDX models implant patient-derived tumor tissue subcutaneously and have recently been called into question for their inability to replicate many tumor characteristics seen in the clinic, including metastasis, treatment response, and resistance.1 Another model, orthotopic PDX (O-PDX), implants tumors (using an immunodeficient mouse model) in the same organ from which they are derived and can provide a more accurate representation of what might happen in the clinic.1-3 Despite these developments, only a handful of head-to-head studies between subcutaneous PDX and O-PDX have been done and widespread adoption of O-PDX has been slow.
At the AACR Annual Meeting 2021, our team from Certis (including Jonathan Nakashima, Jantzen Sperry, Bianca Carapia, Deborah Yan, Angelina Chin, Aliakbar Shahsafaei, Joan Chen, Yuan-Hung Chien, and Christophe Pedros) in collaboration with research groups from UCLA (Noah Federman, Arun Singh, and Fritz C. Eilber) and UCSD (Brian Datnow), presented data comparing therapeutic responses and gene expression profiles in subcutaneous PDX and O-PDX models. We also used an O-PDX model to demonstrate the powerful and precise clinical utility of the method for patients with pediatric rhabdomyosarcoma or recurrent metastatic cancer.
So, if you missed AACR 2021 or didn’t get a chance to see our poster, let’s recap some of the key findings.
Chemotherapy Responses Are Different in Subcutaneous PDX vs O-PDX Colorectal Adenocarcinoma Models
At Certis, we routinely perform O-PDX procedures in several different organs and track tumor growth as a function of time using an M3™ compact MRI from Aspect Imaging (Figure 1).
|
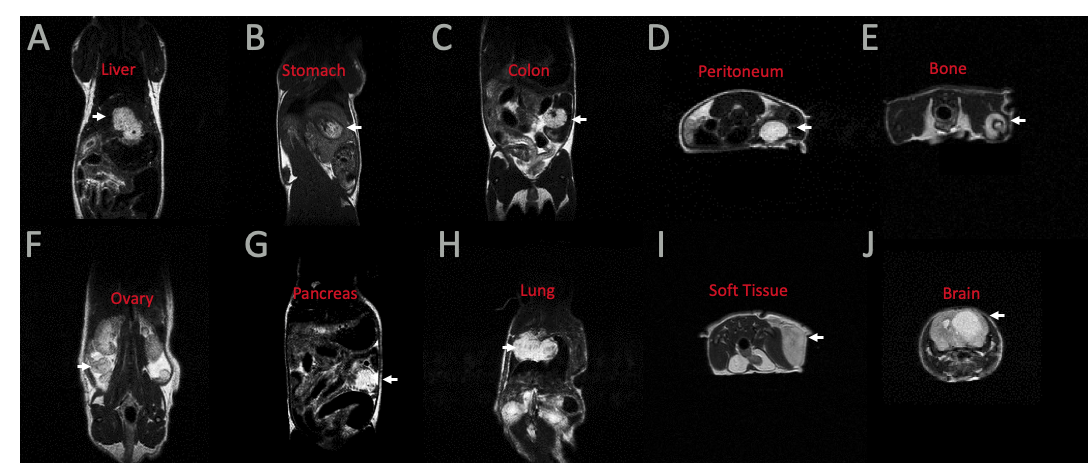
Figure 1. O-PDX implantation in several organs from a variety of tumor types, visualized by MRI. White arrow indicates tumor. A) Metastatic colorectal adenocarcinoma; B) Gastric adenocarcinoma; C) Colorectal adenocarcinoma; D) Liposarcoma; E) Osteosarcoma; F) Ovarian carcinoma; G) Pancreatic ductal adenocarcinoma; H) Lung adenocarcinoma; I) Myxofibrosarcoma; J) Glioblastoma multiforme. |
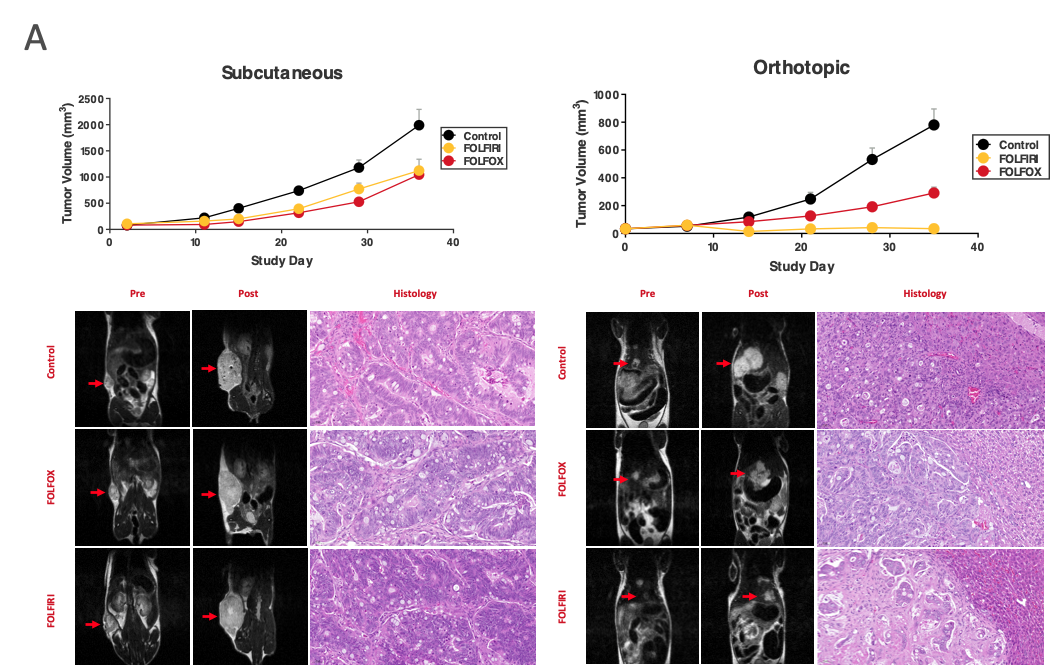
We used a PDX generated from a colorectal adenocarcinoma liver metastasis and implanted them subcutaneously or orthotopically in female NOG mice from Taconic (n=8 for each treatment group), then monitored tumor growth and response to FOLFIRI or FOLFOX over 5 weeks. As you can see in Figure 2A (upper panel), tumor growth was more robust in the subcutaneous PDX model and treatment response was similar in both FOLFIRI or FOLFOX groups.
In contrast, orthotopic implantation showed differences in tumor growth and efficacy between FOLFIRI and FOLFOX, compared to subcutaneous PDX. In the O-PDX model, FOLFIRI treatment inhibited tumor growth more substantially than FOLFOX treatment. Imaging of the tumor and histology confirmed these differences (Figure 2A, bottom panels).
|
Figure 2A. PDX generated from a colorectal adenocarcinoma liver metastasis response differently to chemotherapy, depending on implantation location (n=8). Red arrows in MRI images indicate tumor locations and histology confirms therapeutic responses seen with tumor growth. |
Subcutaneous PDX and O-PDX Models Have Distinct Transcriptional Profiles
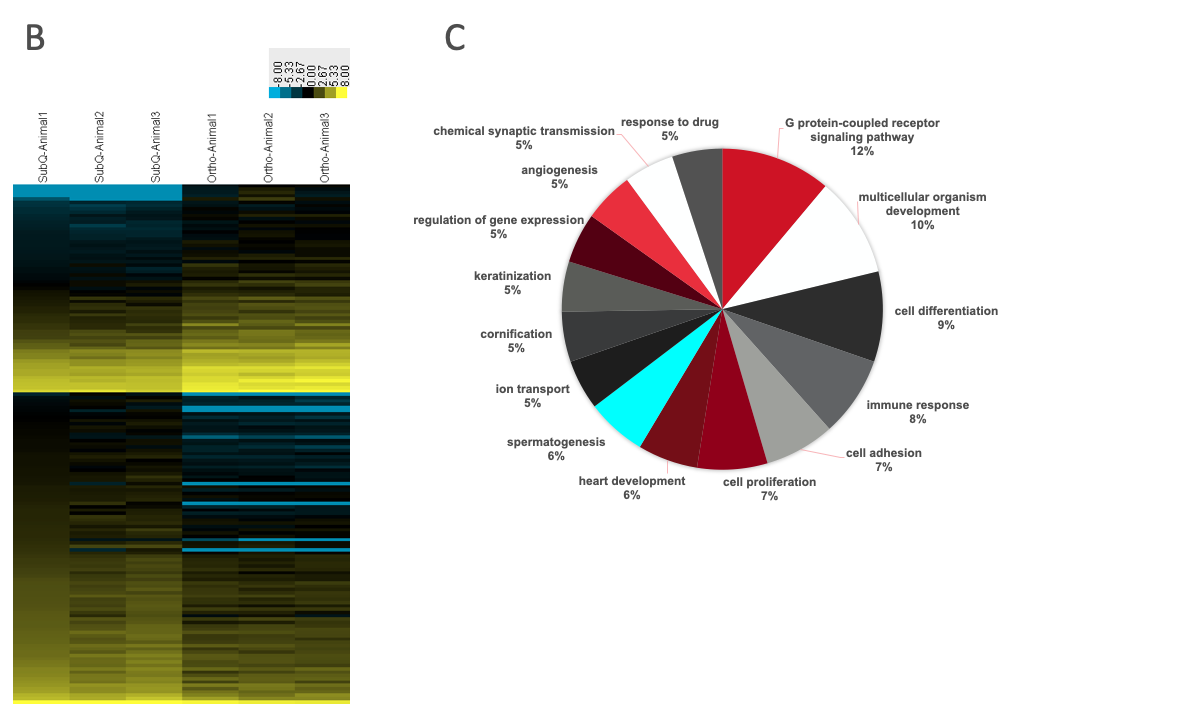
Additional gene expression analysis of 3 animals in the control subcutaneous and orthotopic PDX models revealed significant differences in transcriptomic profiles: 348 genes, across several different signaling pathways, were differentially expressed (Figure 2B & 2C). The most substantial differences in expression were in G-protein coupled receptor (GPCR) signaling (12%) and multicellular organism development (10%) but many pathways, including cell differentiation (9%), immune response pathways (8%), and others showed differential expression. Our group is following up on these analyses to compare gene expression profiles between each PDX model and the primary tumor isolated from the patient to see which model is more accurate.
| Figure 2B and 2C. B) Gene expression analysis identifies 348 genes differentially expressed. C) Pathway analysis of differentially expressed genes. Colors are meant to visually distinguish distinct pathways from one another and do not reflect up or downregulation. |
O-PDX Application in the Clinic
Based on the findings above, other internal studies, and the work of the scientific community, we believe that O-PDX is capable of providing patients and drug developers with accurate, actionable, and personalized data that can help inform their clinical decision-making. We’ve successfully generated numerous O-PDX models from different tumor types, used them to help oncologists and patients make personalized treatment decisions, and developed unique models for pre-clinical drug development.
Individual Patient Testing in a Pediatric Rhabdomyosarcoma O-PDX Model
In Figure 3, we highlight clinical results from a patient with pediatric rhabdomyosarcoma. The original tumor was taken from the right thigh of a patient and implanted in the right thigh of our NOG mouse model. Of the 10 treatments tested (n=8 for each treatment group), several treatment regimens were efficacious, with gemcitabine/docetaxel, cyclophosphamide/vinorelbine, and mocetinostat/vinorelbine treatments resulting in 61.3%, 63.4%, and 96.5% reductions in tumor volume, respectively (Figure 3A & 3B). Tumor histology further confirms these responses to treatment.
Once pharmacological responses were assessed, the data was used by the patient and their treatment team to make an informed decision about which treatment would be the safest and most efficacious. Ultimately, the group chose cyclophosphamide and vinorelbine for the patient, and PET scans of the patient after 4 months of treatment demonstrated strong concordance with the O-PDX testing (Figure 3C).
| Figure 3. Individualized testing in a pediatric rhabdomyosarcoma O-PDX model. A) Summary of results. B) Tumor volumes over time indicated the best therapies and show tumor recurrence upon treatment discontinuation (n=8). C) PET scan of the patient showing no evidence of disease after 4 months of treatment (white arrow), demonstrating concordance with O-PDX study. |
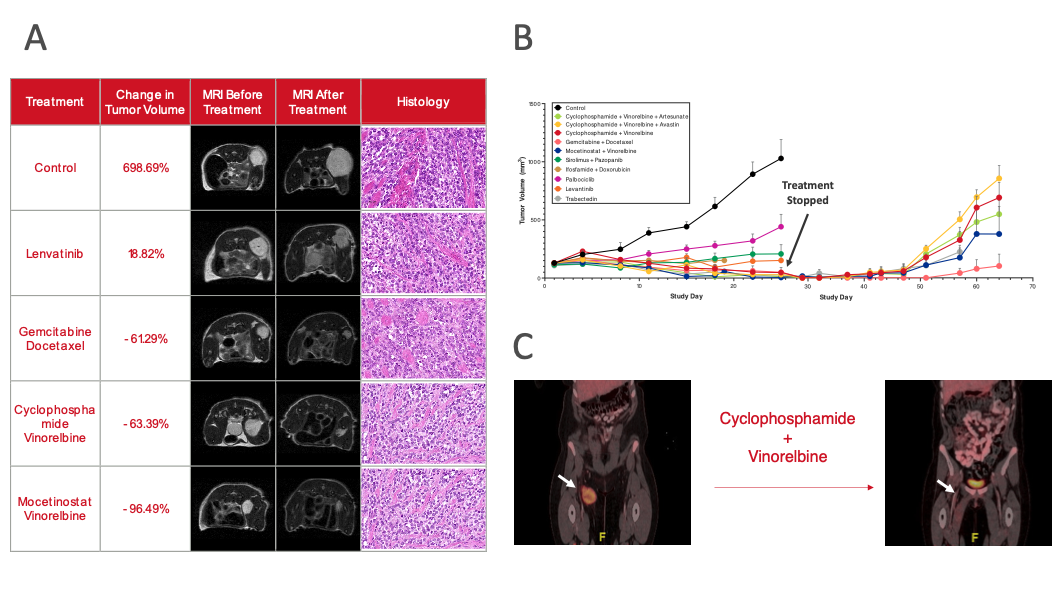
Following the end of the treatment period of the O-PDX models, several treatments were stopped, yet tumor growth continued to be monitored (Figure 3B). This highlights one of the advantages of the O-PDX models: It enables clinical teams to track clinical recurrence for various treatment arms and weigh it when making a treatment decision.
Individual Patient Testing in a Recurrent Metastatic Cancer O-PDX Model
Similar to the case above, we’ve used O-PDX to help make treatment decisions in a patient with recurrent metastatic cancer. Our team tested 5 treatment arms (n=8 for each treatment arm), but only one, gemcitabine/docetaxel, induced significant tumor shrinkage (Figure 4A & 4B). The oncologist treating this patient decided to use this treatment regimen, and the disease remains stable after 5 full cycles of treatment (Figure 4C).
|
Figure 4. Individualized testing on a recurrent metastatic cancer identifies a promising therapy and predicts acquired resistance. A) Summary of results. B) Tumor volumes over time reveal the best therapies and show tumor recurrence upon treatment discontinuation (n=5). Tumors grew during retreatment, indicating tumors acquired resistance to the therapy. C) CT scan of the patient showing stable disease after 5 cycles of treatment (white arrow), demonstrating concordance with O-PDX study. |
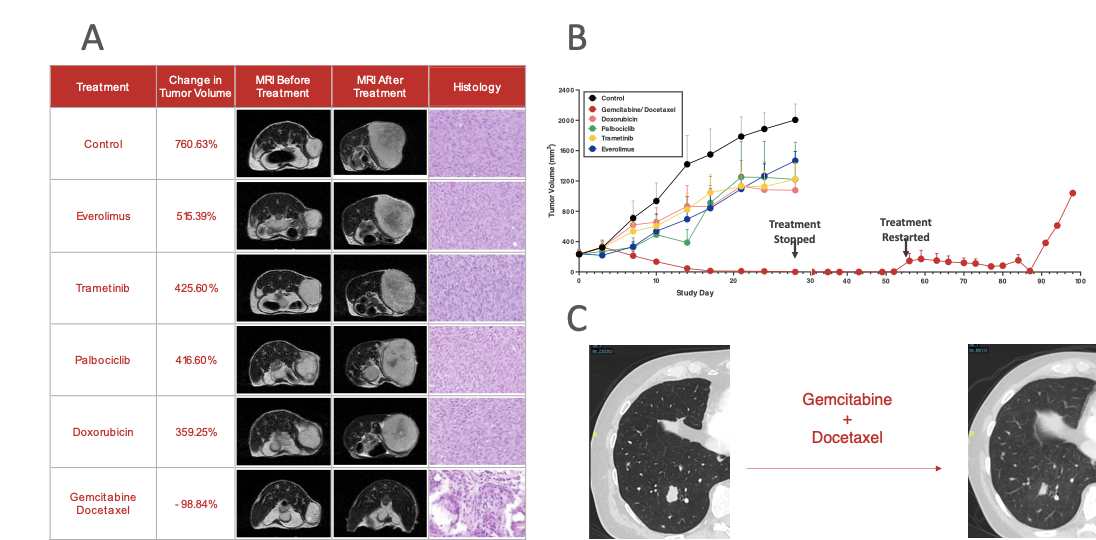
In an attempt to develop a gemcitabine/docetaxel O-PDX resistance model, we stopped treatment, allowing any remaining tumor cells that escaped treatment to reestablish growth. As tumor growth picked up, we reintroduced the gemcitabine/docetaxel regimen to further select for resistant cancer cells. This model will be useful for continued O-PDX testing should any resistance develop during the ongoing treatment of this patient and can help inform downstream treatment options. In addition, the resistance model is useful for drug developers looking to investigate novel treatment options for recurrent metastatic cancer.
the Future of O-PDX and Precision Oncology
While subcutaneous PDX remains the go-to PDX methodology, our results and the ongoing research in the scientific community is shifting the tide. From the tumor types tested and data presented here, we can see that O-PDX models differ in their in vivo pharmacological response and gene expression profiles from subcutaneous PDX models. We’ve also demonstrated that O-PDX can serve as a clinically accurate model for making treatment decisions and developing both recurrence and resistance models that are useful for drug developers and patients.
If you are interested in downloading the full poster, click here.
And for more information about the advantages of O-PDX for drug development and translational research, see how Certis can help de-risk your clinical trials or assess drug efficacy.
References
- Bhimani J, Ball K, Stebbing J. Patient-derived xenograft models—the future of personalised cancer treatment. Br J Cancer. 2020;122:601–602.
- Russell TA, Eckardt MA, Murakami T, et al. Clinical Factors That Affect the Establishment of Soft Tissue Sarcoma Patient-Derived Orthotopic Xenografts: A University of California, Los Angeles, Sarcoma Program Prospective Clinical Trial. JCO Precis Oncol. 2017;2017:10.1200/PO.17.00071.
- Tran Chau V, Liu W, Gerbé de Thoré M, et al. Differential therapeutic effects of PARP and ATR inhibition combined with radiotherapy in the treatment of subcutaneous versus orthotopic lung tumour models. Br J Cancer. 2020;123:762–771.
About the Author:
Elie Diner has a Ph.D. in bioengineering and 12 years of research experience in microbiology, synthetic biology, and immunology. During his time at the bench, he developed a passion for effective science communication and eventually transitioned into a career as a professional science and content writer. He's authored 12 peer-reviewed scientific publications and numerous blogs, whitepapers, and e-books for life science companies.
Back to Feed